
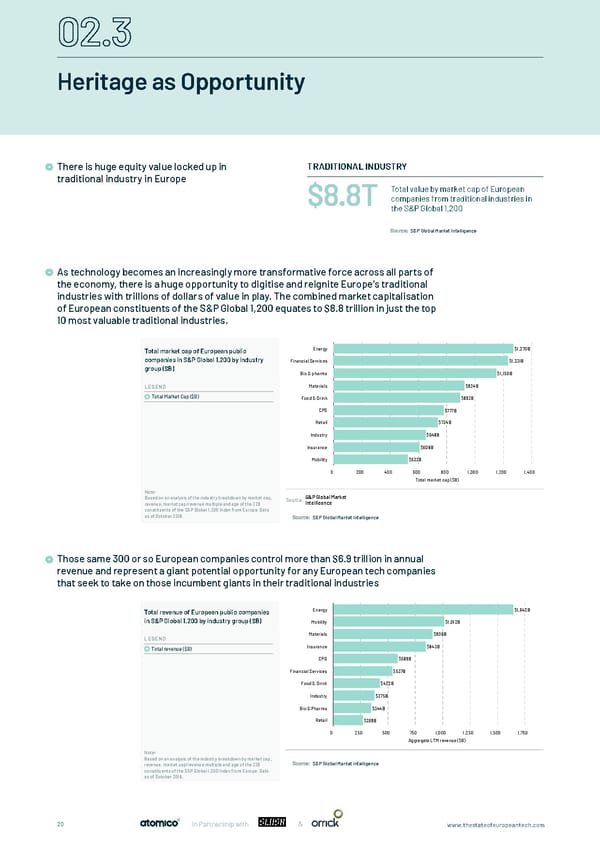
Heritage as Opportunity There is huge equity value locked up in TRADITIONAL INDUSTRY traditional industry in Europe Total value by market cap of European $8.8T companies from traditional industries in the S&P Global 1,200 S&P Global Market Intelligence As technology becomes an increasingly more transformative force across all parts of the economy, there is a huge opportunity to digitise and reignite Europe’s traditional As technology becomes an increasingly more transformative force across all parts of the economy, there is a huge industries with trillions of dollars of value in play. The combined market capitalisation opportunity to digitise and reignite Europe's traditional industries with trillions of dollars of value in play. The of European constituents of the S&P Global 1,200 equates to $8.8 trillion in just the top combined market capitalisation of European constituents of the S&P Global 1,200 equates to $8.8 trillion in just 10 most valuable traditional industries. the top 10 most valuable traditional industries. Total market cap of European public Energy $1,270B companies in S&P Global 1,200 by industry Financial Services $1,231B group ($B) Bio & pharma $1,150B LEGEND Materials $924B Total Market Cap ($B) Food & Drink $893B CPG $777B Retail $734B Industry $648B Insurance $608B Mobility $523B 0 200 400 600 800 1,000 1,200 1,400 Total market cap ($B) Note: Based on an analysis of the industry breakdown by market cap, Source: S&P Global Market revenue, market cap/revenue multiple and age of the 328 Intelligence constituents of the S&P Global 1,200 Index from Europe. Data as of October 2018. S&P Global Market Intelligence Those same 300 or so European companies control more than $6.9 trillion in annual Those same 300 or so European companies control more than $6.9 trillion in annual revenue and represent a giant revenue and represent a giant potential opportunity for any European tech companies potential opportunity for any European tech companies that seek to take on those incumbent giants in their that seek to take on those incumbent giants in their traditional industries traditional industries. Total revenue of European public companies Energy $1,642B in S&P Global 1,200 by industry group ($B) Mobility $1,012B Materials $906B LEGEND Total revenue ($B) Insurance $843B CPG $589B Financial Services $537B Food & Drink $422B Industry $375B Bio & Pharma $344B Retail $269B 0 250 500 750 1,000 1,250 1,500 1,750 Aggregate LTM revenue ($B) Note: Based on an analysis of the industry breakdown by market cap, Source: S&P Global Market S&P Global Market Intelligence revenue, market cap/revenue multiple and age of the 328 Intelligence constituents of the S&P Global 1,200 Index from Europe. Data as of October 2018. 20 In Partnership with & www.thestateofeuropeantech.com
 The State of European Tech Page 19 Page 21