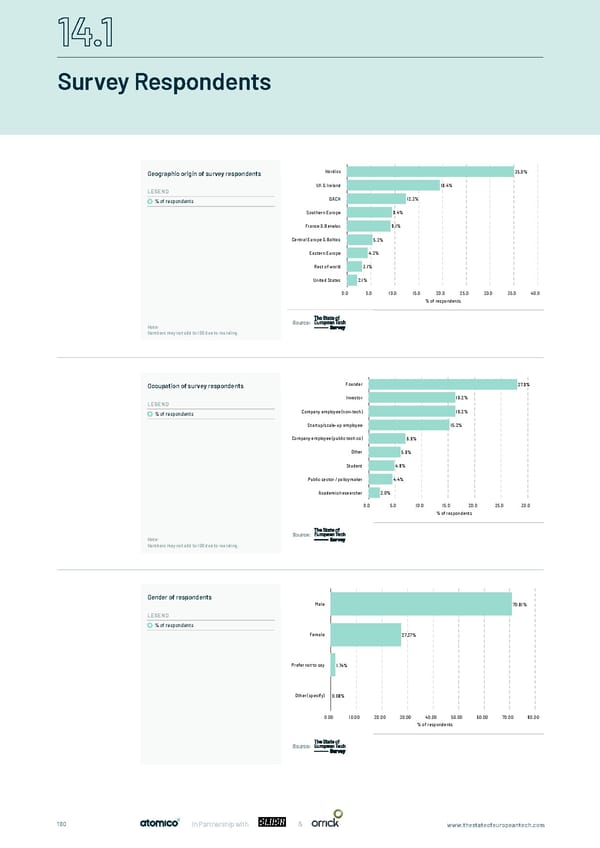
Survey Respondents Geographic origin of survey respondents Nordics 35.0% UK & Ireland 19.4% LEGEND % of respondents DACH 12.3% Southern Europe 9.4% France & Benelux 9.1% Central Europe & Baltics 5.3% Eastern Europe 4.3% Rest of world 3.1% United States 2.1% 0.0 5.0 10.0 15.0 20.0 25.0 30.0 35.0 40.0 % of respondents Note: Source: Numbers may not add to 100 due to rounding. Occupation of survey respondents Founder 27.9% Investor 16.2% LEGEND % of respondents Company employee (non-tech) 16.2% Startup/scale-up employee 15.2% Company employee (public tech co) 6.9% Other 5.9% Student 4.8% Public sector / policymaker 4.4% Academic/researcher 2.0% 0.0 5.0 10.0 15.0 20.0 25.0 30.0 % of respondents Note: Source: Numbers may not add to 100 due to rounding. Gender of respondents Male 70.81% LEGEND % of respondents Female 27.37% Prefer not to say 1.74% Other (specify) 0.08% 0.00 10.00 20.00 30.00 40.00 50.00 60.00 70.00 80.00 % of respondents Source: 160 In Partnership with & www.thestateofeuropeantech.com
 The State of European Tech Page 159 Page 161