
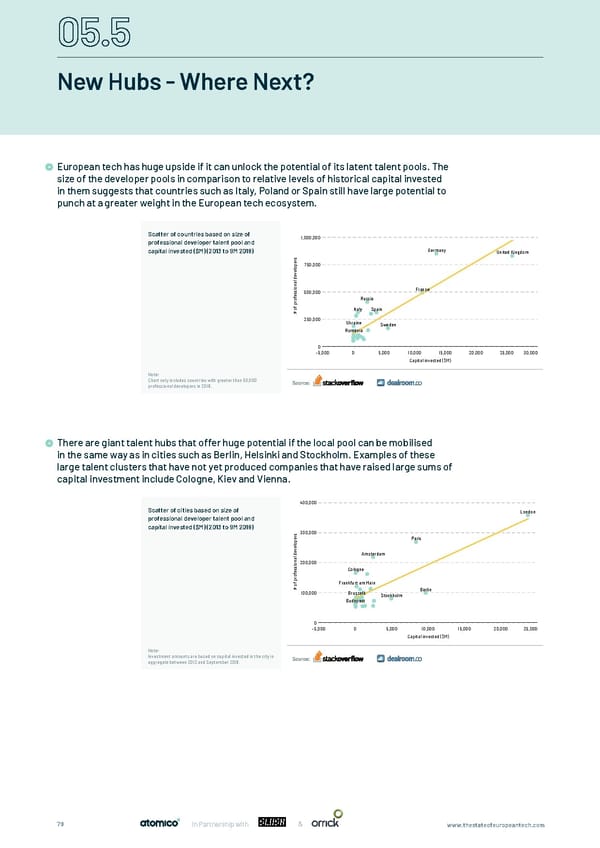
New Hubs - Where Next? European tech has huge upside if it can unlock the potential of its latent talent pools. The size of the developer pools in comparison to relative levels of historical capital invested European tech has huge upside if it can unlock the potential of its latent talent pools. The size of the developer in them suggests that countries such as Italy, Poland or Spain still have large potential to pools in comparison to relative level of historical capital invested in them suggests that countries such as Italy, punch at a greater weight in the European tech ecosystem. Poland or Spain still have large potential to punch at a greater weight in the European tech ecosystem. Scatter of countries based on size of 1,000,000 professional developer talent pool and capital invested ($M) (2013 to 9M 2018) Germany United Kingdom s r pe 750,000 o l e v e d l a n o i France s 500,000 s e f Russia o pr f o Italy Spain # 250,000 Ukraine Sweden Romania 0 -5,000 0 5,000 10,000 15,000 20,000 25,000 30,000 Capital invested ($M) Note: Chart only includes countries with greater than 50,000 Source: professional developers in 2018. There are giant talent hubs that offer huge potential if the local pool can be mobilised in the same way as in cities such as Berlin, Helsinki and Stockholm. Examples of these There are giant talent hubs that offer huge potential if the local pool can be mobilised in the same way that has large talent clusters that have not yet produced companies that have raised large sums of been in achieved in cities such as Berlin, Helsinki and Stockholm. Examples of these large talent clusters that have capital investment include Cologne, Kiev and Vienna. not yet produced companies that have raised large sums of capital investment include Cologne, Kiev and Vienna. 400,000 Scatter of cities based on size of London professional developer talent pool and capital invested ($M) (2013 to 9M 2018) s 300,000 r Paris pe o l e v e Amsterdam d l a n 200,000 o i s s Cologne e f o pr f Frankfurt am Main o # 100,000 Brussels Berlin Stockholm Budapest 0 -5,000 0 5,000 10,000 15,000 20,000 25,000 Capital invested ($M) Note: Investment amounts are based on capital invested in the city in Source: aggregate between 2012 and September 2018. & 79 In Partnership with www.thestateofeuropeantech.com
 The State of European Tech Page 78 Page 80