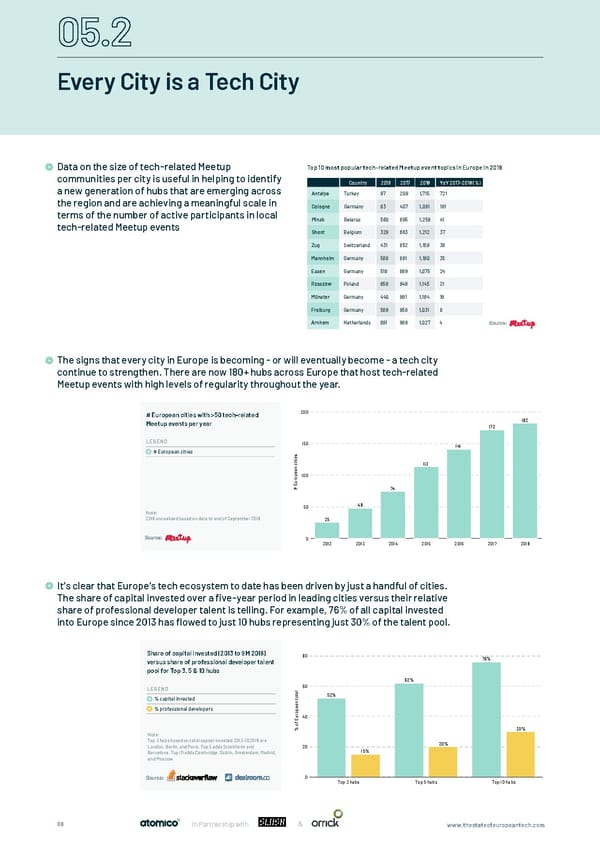
Every City is a Tech City Data on the size of tech-related Meetup communities per city is useful in helping to identify a new generation of hubs that are emerging across the region and are achieving a meaningful scale in terms of the number of active participants in local tech-related Meetup events Data on the size of tech-related Meetup Top 10 most popular tech-related Meetup event topics in Europe in 2018 communities per city is useful in helping to identify Country 2016 2017 2018 YoY 2017-2018 (%) European cities surpassing 1,000 members of a new generation of hubs that are emerging across Antalya Turkey 97 209 1,715 721 tech-related Meetup groups for the ïrst time the region and are achieving a meaningful scale in Cologne Germany 83 407 1,061 161 in 2018 terms of the number of active participants in local Minsk Belarus 580 895 1,259 41 tech-related Meetup events Ghent Belgium 329 883 1,212 37 Zug Switzerland 431 852 1,159 36 Mannheim Germany 586 881 1,190 35 Essen Germany 516 869 1,075 24 Rzeszów Poland 858 946 1,145 21 Münster Germany 440 991 1,184 19 Freiburg Germany 569 958 1,031 8 The signs that every city is becoming - or will eventually become - a tech city in Europe continue to strengthen. There are now more 180+ hubs across Europe that host tech-related Meetup events with high levels of regularity Arnhem Netherlands 691 989 1,027 4 throughout the year. Source: # European cities with >50 tech-related 200 The signs that every city in Europe is becoming - or will eventually become - a tech city 182 Meetup events per year The signs that every city is becoming - or will eventually become - a tech city in Europe continue to strengthen. continue to strengthen. There are now 180+ hubs across Europe that host tech-related 172 There are now more 180+ hubs across Europe that host tech-related Meetup events with high levels of regularity LEGEND Meetup events with high levels of regularity throughout the year. throughout the year. 150 141 # European cities s e i t i c 113 n 200 # European cities with >50 tech-related a pe100 o 182 Meetup events per year r u 172 E 74 # LEGEND 150 50 48 141 # European cities s e i t i 25 c 113 n a pe100 o r u 0 E 2012 2013 2014 2015 2016 2017 2018 # 74 50 48 Note: Source: 2018 annualised based on data to end of September 2018 25 The extent to which the growth of the European tech ecosystem to now has been driven by just a handful of cities 0 2012 2013 2014 2015 2016 2017 2018 is evident by comparing the share of capital invested over a �ve-year period in those leading cities versus their relative share of professional developer talent. For example, 76% of all capital invested into Europe since 2013 has Source: �owed to just 10 hubs representing just 30% of the talent pool. Note: 2018 annualised based on data to end of September 2018 It’s clear that Europe’s tech ecosystem to date has been driven by just a handful of cities. Share of capital invested (2013 to 9M 2018) 80 The extent to which the growth of the European tech ecosystem to now has been driven by just a handful of cities The share of capital invested over a five-year period in leading cities versus their relative 76% versus share of professional developer talent is evident by comparing the share of capital invested over a �ve-year period in those leading cities versus their pool for Top 3, 5 & 10 hubs share of professional developer talent is telling. For example, 76% of all capital invested relative share of professional developer talent. For example, 76% of all capital invested into Europe since 2013 has 62% into Europe since 2013 has flowed to just 10 hubs representing just 30% of the talent pool. 60 �owed to just 10 hubs representing just 30% of the talent pool. LEGEND l a t 52% o % capital invested t n % professional developers a pe o Share of capital invested (2013 to 9M 2018) r 80 u 40 76% E versus share of professional developer talent f o 30% pool for Top 3, 5 & 10 hubs % 62% 20% 60 LEGEND l 20 a 15% t 52% o % capital invested t n % professional developers a pe o r u 40 E 0 f Top 3 hubs Top 5 hubs Top 10 hubs o 30% Note: % Top 3 hubs based on total capital invested 2013-3Q2018 are Source: 20% London, Berlin, and Paris. Top 5 adds Stockholm and 20 Barcelona. Top 10 adds Cambridge, Dublin, Amsterdam, Madrid, 15% and Moscow. 0 Top 3 hubs Top 5 hubs Top 10 hubs Note: Top 3 hubs based on total capital invested 2013-3Q2018 are Source: London, Berlin, and Paris. Top 5 adds Stockholm and Barcelona. Top 10 adds Cambridge, Dublin, Amsterdam, Madrid, and Moscow. & 68 In Partnership with www.thestateofeuropeantech.com
 The State of European Tech Page 67 Page 69