
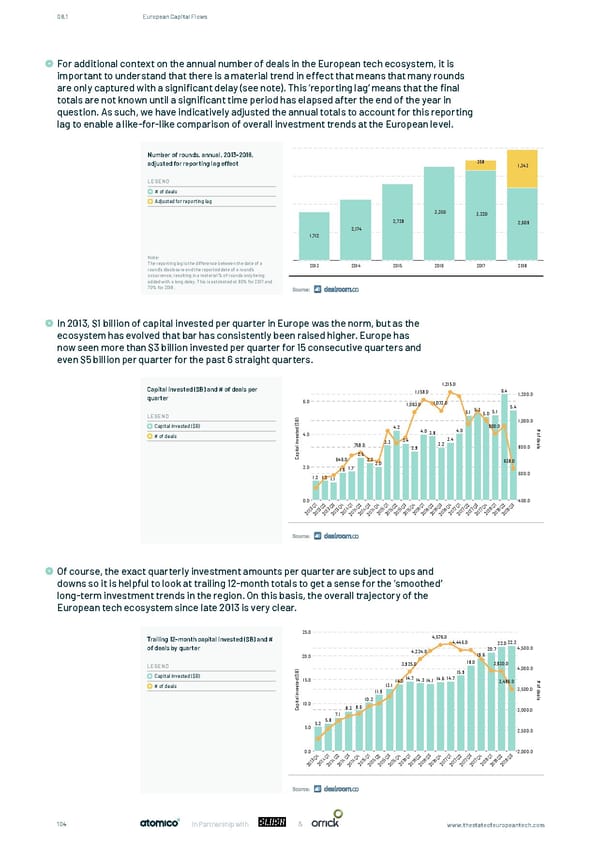
08.1 European Capital Flows For additional context on the annual number of deals in the European tech ecosystem, it is important to understand that there is a material trend in effect that means that many rounds For additional context on the annual number of deals in the European tech ecosystem, it is important to are only captured with a significant delay (see note). This ‘reporting lag’ means that the final understand there is a material trend in effect that means many rounds are only captured with a signi cant delay totals are not known until a significant time period has elapsed after the end of the year in (see note). This 'reporting lag' means that the nal totals are not known until a signi cant time period has elapsed question. As such, we have indicatively adjusted the annual totals to account for this reporting after the end of the year in question. As such, we have indicatively adjusted the annual totals to account for this lag to enable a like-for-like comparison of overall investment trends at the European level. reporting lag to enable a like-for-like comparison of overall investment trends at the European level. Number of rounds, annual, 2013-2018, adjusted for reporting lag effect 358 1,343 LEGEND # of deals Adjusted for reporting lag 3,350 3,220 2,728 2,609 2,174 1,712 Note: The reporting lag is the difference between the date of a 2013 2014 2015 2016 2017 2018 round’s disclosure and the reported date of a round’s occurrence, resulting in a material % of rounds only being added with a long delay. This is estimated at 90% for 2017 and 70% for 2018. In 2013, $1 billion of capital invested per quarter in Europe was the norm, but as the ecosystem has evolved that bar has consistently been raised higher. Europe has In 2013, $1B of capital invested per quarter in Europe was the norm, but as the ecosystem has evolved that bar has now seen more than $3 billion invested per quarter for 15 consecutive quarters and consistently been raised higher. Europe has now seen more than $3B invested per quarter for 15 consecutive even $5 billion per quarter for the past 6 straight quarters. quarters and even $5B per quarter for the past 6 straight quarters. Capital invested ($B) and # of deals per 1,215.0 1,159.0 6.4 1,200.0 quarter 6.0 1,063.0 1,073.0 5.4 5.1 5.3 5.0 5.1 LEGEND ) B 1,000.0 $ ( Capital invested ($B) 4.2 900.0 # d 4.0 e 4.0 o t 4.0 3.8 f # of deals s e d v 3.4 3.4 e n 3.3 a i 3.2 l l 759.0 800.0 s a 2.9 t pi 2.5 a C 646.0 2.2 638.0 2.0 2.0 1.6 1.7 1.2 1.2 600.0 1.1 0.0 400.0 1 2 3 4 1 2 3 4 1 2 3 4 1 2 3 4 1 2 3 4 1 2 3 Q Q Q Q Q Q Q Q Q Q Q Q Q Q Q Q Q Q Q Q Q Q Q 3 4 5 6 7 7 8 1 3 3 3 1 4 4 4 1 5 5 5 1 6 6 6 1 7 1 7 1 8 8 0 1 1 1 0 1 1 1 0 1 1 1 0 1 1 1 0 1 0 1 0 1 1 2 0 0 0 2 0 0 0 2 0 0 0 2 0 0 0 2 0 2 0 2 0 0 2 2 2 2 2 2 2 2 2 2 2 2 2 2 2 2 Of course, the exact quarterly investment amounts per quarter are subject to ups and downs so it is helpful to look at trailing 12-month totals to get a sense for the ‘smoothed’ Of course, the exact quarterly investment amounts per quarter are subject to ups and downs so it is helpful to look long-term investment trends in the region. On this basis, the overall trajectory of the at trailing 12-month totals to get a sense for the 'smoothed' long-term investment trends in the region. On this European tech ecosystem since late 2013 is very clear. basis, the overall trajectory of the European tech ecosystem since late 2013 is very clear. 25.0 Trailing 12-month capital invested ($B) and # 4,576.0 4,445.0 22.022.2 of deals by quarter 4,224.0 20.7 4,500.0 20.0 19.6 LEGEND 3,925.0 18.0 3,930.0 ) 4,000.0 B 15.9 $ Capital invested ($B) ( 14.7 14.6 14.7 # d 15.0 14.0 14.3 14.1 3,496.0 e o t 13.1 f # of deals s e 3,500.0 d v 11.9 e n a i l l s a 10.2 t 10.0 pi a 8.3 8.6 C 7.1 3,000.0 5.2 5.8 5.0 2,500.0 0.0 2,000.0 4 1 2 3 4 1 2 3 4 1 2 3 4 1 2 3 4 1 2 3 Q Q Q Q Q Q Q Q Q Q Q Q Q Q Q Q Q Q Q Q 4 5 6 7 7 8 3 1 4 4 4 1 5 5 5 1 6 6 6 1 7 1 7 1 8 8 1 0 1 1 1 0 1 1 1 0 1 1 1 0 1 0 1 0 1 1 0 2 0 0 0 2 0 0 0 2 0 0 0 2 0 2 0 2 0 0 2 2 2 2 2 2 2 2 2 2 2 2 2 2 104 In Partnership with & www.thestateofeuropeantech.com
 The State of European Tech Page 103 Page 105