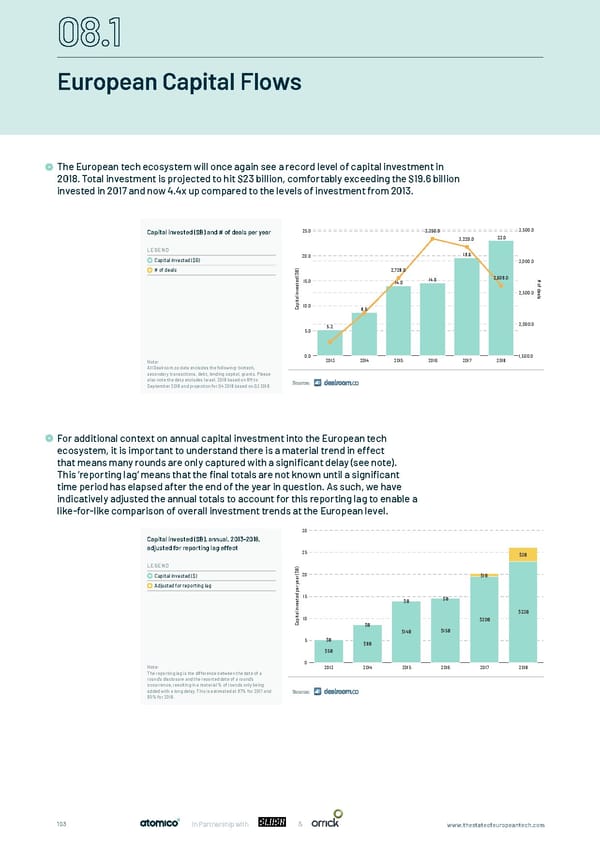
European Capital Flows The European tech ecosystem will once again see a record level of capital investment in 2018. Total investment is projected to hit $23 billion, comfortably exceeding the $19.6 billion The European tech ecosystem will once again see a record level of capital investment in 2018. Total investment is invested in 2017 and now 4.4x up compared to the levels of investment from 2013. projected to hit $23B, comfortably exceeding the $19.6B invested in 2017 and now 4.4x up compared to the levels of investment from 2013. Capital invested ($B) and # of deals per year 25.0 3,350.0 3,500.0 3,220.0 23.0 LEGEND 20.0 19.6 Capital invested ($B) 3,000.0 # of deals ) 2,728.0 B $ ( 2,609.0 # d 14.6 e 15.0 o t 14.0 f s e d v e n 2,500.0 a i l l s a t pi a 10.0 C 8.6 5.2 2,000.0 5.0 0.0 1,500.0 Note: 2013 2014 2015 2016 2017 2018 All Dealroom.co data excludes the following: biotech, secondary transactions, debt, lending capital, grants. Please also note the data excludes Israel. 2018 based on 9M to September 2018 and projection for Q4 2018 based on Q3 2018 For additional context on annual capital investment into the European tech ecosystem, it is important to understand there is a material trend in effect that means many rounds are only captured with a significant delay (see note). For additional context on annual capital investment into the European tech ecosystem, it is important to This ‘reporting lag’ means that the final totals are not known until a significant understand there is a material trend in effect that means that many rounds are only captured with a signi cant time period has elapsed after the end of the year in question. As such, we have delay (see note). This 'reporting lag' means that the nal totals are not known until a signi cant time period has indicatively adjusted the annual totals to account for this reporting lag to enable a elapsed after the end of the year in question. As such, we have indicatively adjusted the annual totals to account like-for-like comparison of overall investment trends at the European level. for this reporting lag to enable a like-for-like comparison of overall investment trends at the European level. 30 Capital invested ($B), annual, 2013-2018, adjusted for reporting lag effect 25 $3B LEGEND ) B $ ( 20 $1B Capital invested ($) r a e y Adjusted for reporting lag r pe d 15 e t $B s $B e v n i l $23B a t 10 pi $20B a C $B $14B $15B 5 $B $9B $5B Note: 0 2013 2014 2015 2016 2017 2018 The reporting lag is the difference between the date of a round’s disclosure and the reported date of a round’s occurrence, resulting in a material % of rounds only being added with a long delay. This is estimated at 97% for 2017 and 90% for 2018. 103 In Partnership with & www.thestateofeuropeantech.com
 The State of European Tech Page 102 Page 104