
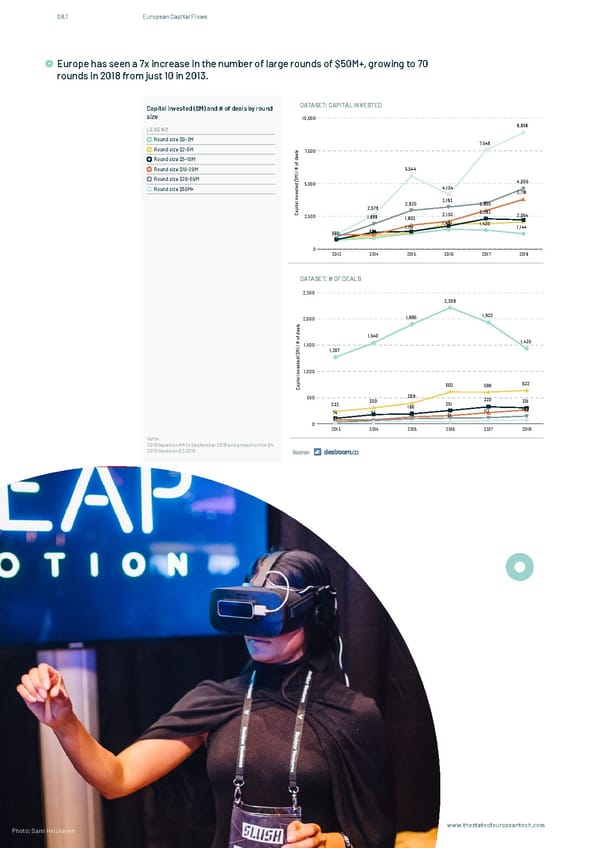
08.1 European Capital Flows Europe has seen a 7x increase in the number of large rounds of $50M+, growing to 70 Only the smallest rounds have seen a slight decrease in both capital invested and number of deals, which indicates rounds in 2018 from just 10 in 2013. that round sizes are increasing Capital invested ($M) and # of deals by round DATASET: CAPITAL INVESTED size 10,000 LEGEND 8,868 Round size $0-2M 7,549 Round size $2-5M s 7,500 l a e Round size $5-10M d f o # 5,544 Round size $10-20M / ) M Round size $20-50M $ ( 5,000 4,606 d e 4,154 Round size $50M+ t s 3,781 e v n i 3,193 l a 2,930 2,930 t 2,579 pi a 2,292 C 2,500 1,898 1,803 2,103 2,054 1,491 1,430 1,151 1,144 660 834 0 2013 2014 2015 2016 2017 2018 Only the smallest rounds have seen a slight decrease in both capital invested and number of deals, which indicates that round sizes are increasing DATASET: # OF DEALS 2,500 Capital invested ($M) and # of deals by round 2,208 size DATASET: # OF DEALS 2,000 1,890 1,922 s l a LEGEND e d f 1,540 o 1,430 Round size $0-2M # 1,500 / ) 1,267 Round size $2-5M M $ ( d e Round size $5-10M t s e v1,000 Round size $10-20M n i l a Round size $20-50M t pi 602 599 632 a Round size $50M+ C 500 389 320 232 300 251 301 186 113 143 74 73 42 31 0 2013 2014 2015 2016 2017 2018 Note: 2018 based on 9M to September 2018 and projection for Q4 Note: 2018 based on Q3 2018 2018 annualised based on data to September 2018. 106 In Partnership with & www.thestateofeuropeantech.com www.thestateofeuropeantech.com Photo: Sami Heiskanen
 The State of European Tech Page 105 Page 107