
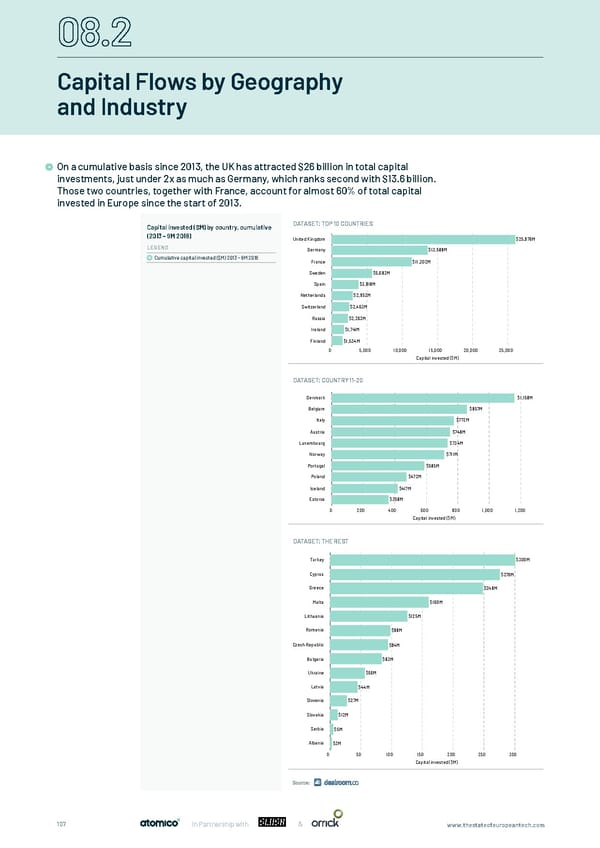
Capital Flows by Geography and Industry On a cumulative basis since 2013, the UK has attracted $26 billion in total capital investments, just under 2x as much as Germany, which ranks second with $13.6 billion. On a cumulative basis since 2013, the UK has attracted $26B in total capital investments, just under 2x as much as Germany that ranks second with $13.6B. Those two countries, together with France, account for almost 60% of Those two countries, together with France, account for almost 60% of total capital total capital invested in Europe since the start of 2013. invested in Europe since the start of 2013. Capital invested ($M) by country, cumulative DATASET: TOP 10 COUNTRIES (2013 - 9M 2018) United Kingdom $25,976M LEGEND Germany $13,588M Cumulative capital invested ($M) 2013 - 9M 2018 France $11,302M Sweden $5,683M Spain $3,818M Netherlands $2,952M Switzerland $2,463M Russia $2,263M Ireland $1,741M Finland $1,534M On a cumulative basis since 2013, the UK has attracted $26B in total capital investments, just under 2x as much as 0 5,000 10,000 15,000 20,000 25,000 Germany that ranks second with $13.6B. Those two countries, together with France, account for almost 60% of total capital invested in Europe since the start of 2013. Capital invested ($M) DATASET: COUNTRY 11-20 Capital invested ($M) by country, cumulative (2013 - 9M 2018) Denmark $1,158M DATASET: COUNTRIES 11-20 Belgium $857M LEGEND Italy $772M Cumulative capital invested ($M) 2013 - 9M 2018 Austria $748M Luxembourg $734M Norway $711M Portugal $585M Poland $472M On a cumulative basis since 2013, the UK has attracted $26B in total capital investments, just under 2x as much as Iceland $417M Germany that ranks second with $13.6B. Those two countries, together with France, account for almost 60% of Estonia $358M total capital invested in Europe since the start of 2013. 0 200 400 600 800 1,000 1,200 Capital invested ($M) Capital invested ($M) by country, cumulative (2013 - 9M 2018) DATASET: THE REST DATASET: THE REST LEGEND Turkey $300M Cumulative capital invested ($M) 2013 - 9M 2018 Cyprus $276M Greece $248M Malta $160M Lithuania $125M Romania $98M Czech Republic $94M Bulgaria $83M Ukraine $56M Latvia $44M Slovenia $27M Slovakia $12M Serbia $5M Albania $3M 0 50 100 150 200 250 300 Capital invested ($M) 107 In Partnership with & www.thestateofeuropeantech.com
 The State of European Tech Page 106 Page 108