
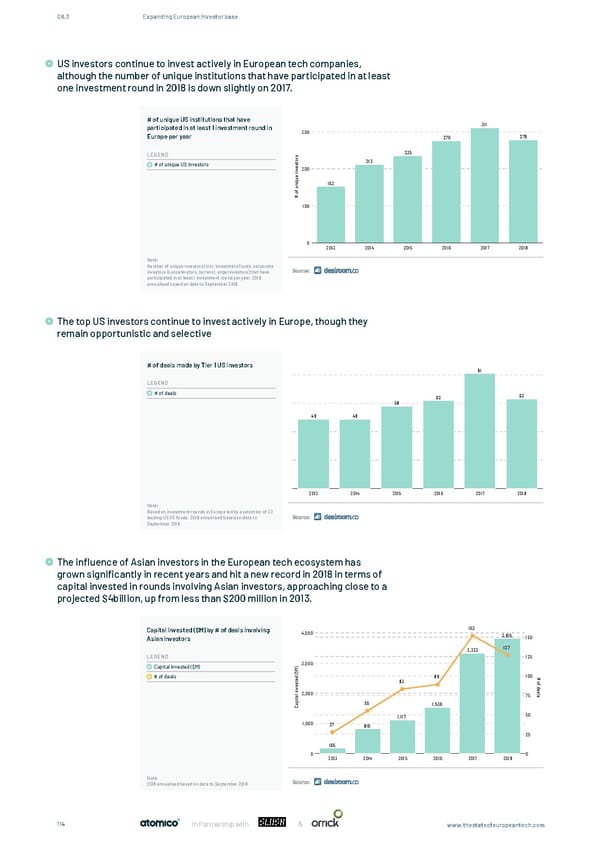
08.3 Expanding European investor base US investors continue to invest actively in European tech companies, although the number of unique institutions that have participated in at least US investors continue to invest actively in European tech companies, although the number of unique institutions one investment round in 2018 is down slightly on 2017. that have participated in at least one investment round in 2018 is down slightly on 2017. # of unique US institutions that have participated in at least 1 investment round in 311 300 Europe per year 276 279 LEGEND s 235 r o 212 t # of unique US investors s e v200 n i e qu i 153 n u f o # 100 0 2013 2014 2015 2016 2017 2018 Note: Number of unique investors (incl. investment funds, corporate Source: investors & accelerators, but excl. angel investors) that have participated in at least 1 investment round per year. 2018 annualised based on data to September 2018. The top US investors continue to invest actively in Europe, though they The top US investors continue to invest actively in Europe, remain opportunistic and selective though they remain opportunistic and selective. # of deals made by Tier 1 US investors 81 LEGEND # of deals 63 62 58 49 49 2013 2014 2015 2016 2017 2018 Note: Based on investment rounds in Europe led by a selection of 22 Source: leading US VC funds. 2018 annualised based on data to September 2018. The influence of Asian investors in the European tech ecosystem has grown significantly in recent years and hit a new record in 2018 in terms of The in�uence of Asian investors in the European tech ecosystem has grown signi�cantly in recent years and hit a capital invested in rounds involving Asian investors, approaching close to a new record in 2018 in terms of capital invested, approaching close to a projected $4B, up from less than $200M in projected $4billion, up from less than $200 million in 2013. 2013. Capital invested ($M) by # of deals involving 152 4,000 3,815 Asian investors 150 3,323 127 LEGEND 125 Capital invested ($M) )3,000 M $ ( 100 # # of deals d 89 e o t 83 f s e d v e n a i l s l2,000 75 a t pi 55 a 1,536 C 1,117 50 1,000 27 816 25 165 0 0 2013 2014 2015 2016 2017 2018 Note: Source: 2018 annualised based on data to September 2018 & 114 In Partnership with www.thestateofeuropeantech.com
 The State of European Tech Page 113 Page 115