
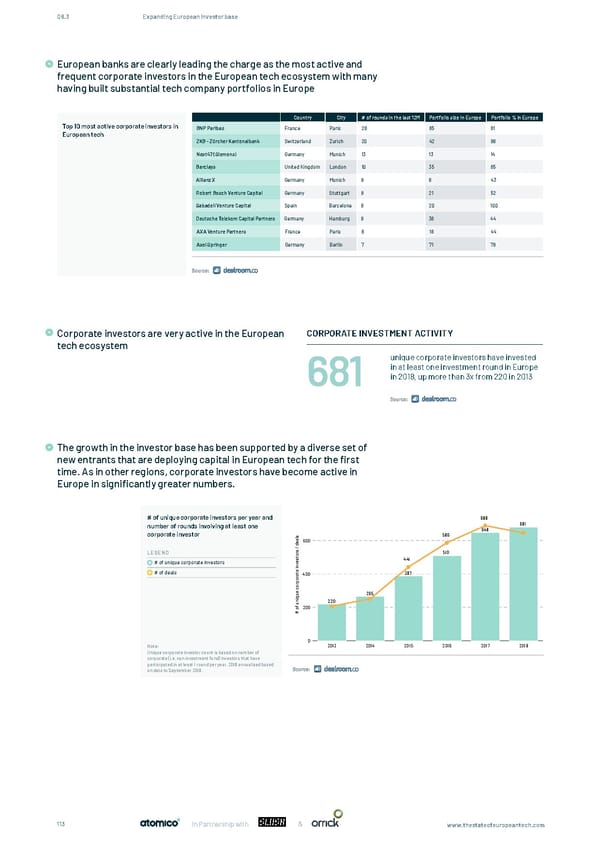
08.3 Expanding European investor base European banks are clearly leading the charge as the most active and frequent corporate investors in the European tech ecosystem with many having built substantial tech company portfolios in Europe European banks are clearly leading the charge as the most active and frequent corporate investors in the European tech ecosystem with many having built substantial tech company portfolios in Europe Country CIty # of rounds in the last 12M Portfolio size in Europe Portfolio % in Europe Top 10 most active corporate investors in BNP Paribas France Paris 28 85 81 European tech ZKB - Zürcher Kantonalbank Switzerland Zurich 20 42 98 Next47 (Siemens) Germany Munich 13 13 14 Barclays United Kingdom London 10 35 65 Allianz X Germany Munich 9 6 43 Robert Bosch Venture Capital Germany Stuttgart 9 21 52 Sabadell Venture Capital Spain Barcelona 8 20 100 Deutsche Telekom Capital Partners Germany Hamburg 8 36 44 AXA Venture Partners France Paris 8 18 44 Axel Springer Germany Berlin 7 71 76 Source: Corporate investors are very active in the European CORPORATE INVESTMENT ACTIVITY tech ecosystem unique corporate investors have invested in at least one investment round in Europe 681 in 2018, up more than 3x from 220 in 2013 The growth in the investor base has been supported by a diverse set of The growth in the investor base has been supported by a diverse set of new entrants that are deploying capital in new entrants that are deploying capital in European tech for the first European tech for the rst time. As in other regions, corporate investors have become active in Europe in time. As in other regions, corporate investors have become active in signi cantly greater numbers. In 2018, more than 680 unique corporates participated in at least one investment in Europe in significantly greater numbers. Europe, up 3.1x from 220 in 2013. # of unique corporate investors per year and 688 number of rounds involving at least one 681 corporate investor 648 s 586 l a 600 e d / s LEGEND r 510 o t s 441 # of unique corporate investors e v n i e # of deals t 400 387 a r po r o c e 265 qu i n 220 u f 200 o # 0 Note: 2013 2014 2015 2016 2017 2018 Unique corporate investor count is based on number of corporate (i.e. non investment fund) investors that have participated in at least 1 round per year. 2018 annualised based Source: on data to September 2018. 113 In Partnership with & www.thestateofeuropeantech.com
 The State of European Tech Page 112 Page 114