
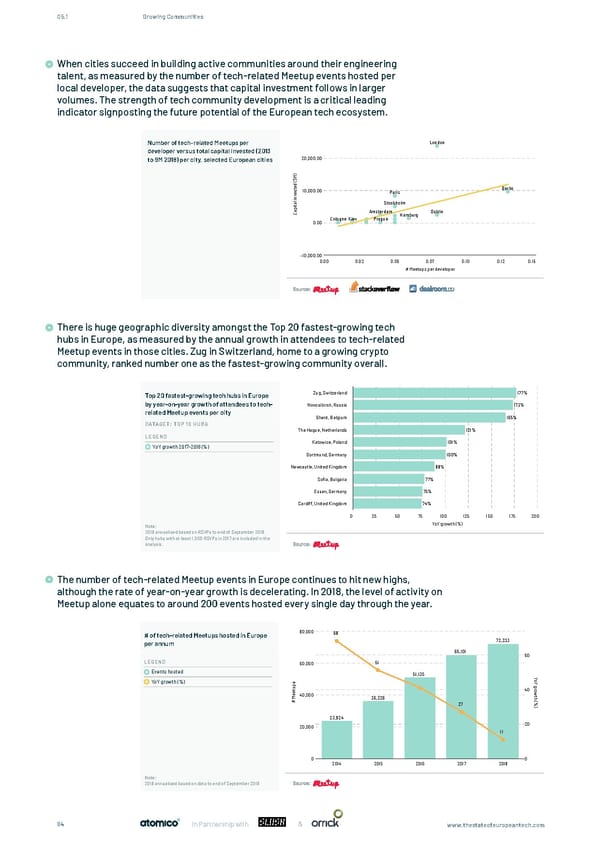
05.1 Growing Communities When cities succeed in building active communities around their engineering talent, as measured by the number of tech-related Meetup events hosted per local developer, the data suggests that capital investment follows in larger When cities succeed in building active communities around their engineering talent, as measured by the number volumes. The strength of tech community development is a critical leading of tech-related Meetup events hosted per local developer, the data suggests that capital investment follows in indicator signposting the future potential of the European tech ecosystem. larger volumes. Number of tech-related Meetups per London developer versus total capital invested (2013 to 9M 2018) per city, selected European cities 20,000.00 ) M $ ( d e t Berlin s 10,000.00 Paris e v n i l a Stockholm t pi a Amsterdam Dublin C Hamburg 0.00 Cologne Kiev Prague -10,000.00 0.00 0.02 0.05 0.07 0.10 0.12 0.15 # Meetups per developer Source: There is huge geographic diversity amongst the Top 20 fastest-growing tech There is huge geographic diversity amongst the Top 20 fastest-growing tech hubs in Europe, as measured by the hubs in Europe, as measured by the annual growth in attendees to tech-related annual growth in attendees to tech-related Meetup events in those cities. Zug in Switzerland, home to a growing There is huge geographic diversity amongst the Top 20 fastest-growing tech hubs in Europe, as measured by the Meetup events in those cities. Zug in Switzerland, home to a growing crypto crypto community, ranked number one as the fastest-growing community overall. annual growth in attendees to tech-related Meetup events in those cities. Zug in Switzerland, home to a growing community, ranked number one as the fastest-growing community overall. crypto community, ranked number one as the fastest-growing community overall. Top 20 fastest-growing tech hubs in Europe Zug, Switzerland 177% by year-on-year growth of attendees to tech- Novosibirsk, Russia 173% Top 20 fastest-growing tech hubs in Europe Zug, Switzerland 177% related Meetup events per city by year-on-year growth of attendees to tech- Novosibirsk, Russia 173% Ghent, Belgium 165% DATASET: TOP 10 HUBS related Meetup events per city Ghent, Belgium 165% The Hague, Netherlands 121% DATASET: TOP 10 HUBS LEGEND Katowice, Poland 101% The Hague, Netherlands 121% YoY growth 2017-2018 (%) LEGEND Katowice, Poland 101% YoY growth 2017-2018 (%) Dortmund, Germany 100% Newcastle, United Kingdom 88% Dortmund, Germany 100% Newcastle, United Kingdom 88% Sofia, Bulgaria 77% Sofia, Bulgaria 77% Essen, Germany 75% Cardiff, United Kingdom 74% Essen, Germany 75% Cardiff, United Kingdom 74% 0 25 50 75 100 125 150 175 200 YoY growth (%) 0 25 50 75 100 125 150 175 200 Note: YoY growth (%) 2018 annualised based on RSVPs to end of September 2018. Only hubs with at least 1,000 RSVPs in 2017 are included in the Source: Note: analysis. 2018 annualised based on RSVPs to end of September 2018. Only hubs with at least 1,000 RSVPs in 2017 are included in the Source: analysis. The number of tech-related Meetup events in Europe continues to hit new highs, although the rate of year-on-year The number of tech-related Meetup events in Europe continues to hit new highs, growth is decelerating. In 2018, the level of activity on Meetup alone equates to around 200 events hosted every The number of tech-related Meetup events in Europe continues to hit new highs, although the rate of year-on-year although the rate of year-on-year growth is decelerating. In 2018, the level of activity on single day through the year. growth is decelerating. In 2018, the level of activity on Meetup alone equates to around 200 events hosted every Meetup alone equates to around 200 events hosted every single day through the year. single day through the year. # of tech-related Meetups hosted in Europe 80,000 68 per annum 80,000 72,233 # of tech-related Meetups hosted in Europe 68 per annum 65,101 72,233 60 LEGEND 60,000 51 65,101 Events hosted 60 LEGEND 60,000 51 51,135 Y o YoY growth (%) Y Events hosted ps 51,135 g u Yr t 40 oo e Ywt YoY growth (%) e 40,000 h psM 36,226 g r u ( t# 40 o% e 27 wt) e 40,000 h M 36,226 ( # 27 % 23,924 20 ) 20,000 23,924 11 20,000 20 11 0 0 2014 2015 2016 2017 2018 0 0 2014 2015 2016 2017 2018 Note: Source: 2018 annualised based on data to end of September 2018 Note: Source: 2018 annualised based on data to end of September 2018 & 64 In Partnership with www.thestateofeuropeantech.com
 The State of European Tech Page 63 Page 65