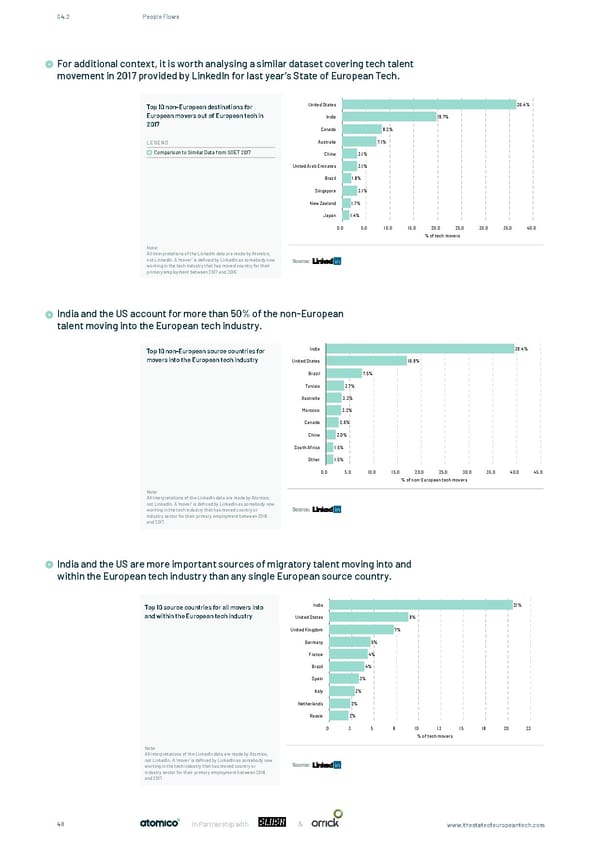
04.2 People Flows For additional context, it is worth analysing a similar dataset covering tech talent For additional context, it is worth analysing a similar dataset covering tech talent movement in 2017 provided by movement in 2017 provided by LinkedIn for last year’s State of European Tech. LinkedIn for last year’s State of European Tech Top 10 non-European destinations for United States 36.4% European movers out of European tech in India 19.7% 2017 Canada 8.2% LEGEND Australia 7.1% Comparison to Similar Data from SOET 2017 China 3.1% United Arab Emirates 3.1% Brazil 1.8% Singapore 3.1% New Zealand 1.7% Japan 1.4% 0.0 5.0 10.0 15.0 20.0 25.0 30.0 35.0 40.0 % of tech movers Note: All interpretations of the LinkedIn data are made by Atomico, not LinkedIn. A ‘mover’ is deïned by LinkedIn as somebody now Source: working in the tech industry that has moved country for their primary employment between 2017 and 2016. India and the US account for more than 50% of the non-European India and the US account for more than 50% of the non- European talent moving into the European tech industry talent moving into the European tech industry. Top 10 non-European source countries for India 39.4% movers into the European tech industry United States 16.9% Brazil 7.5% Tunisia 3.7% Australia 3.3% Morocco 3.2% Canada 2.6% China 2.0% South Africa 1.5% Other 1.5% 0.0 5.0 10.0 15.0 20.0 25.0 30.0 35.0 40.0 45. 0 % of non-European tech movers Note: All interpretations of the LinkedIn data are made by Atomico, not LinkedIn. A 'mover' is deïned by LinkedIn as somebody now Source: working in the tech industry that has moved country or industry sector for their primary employment between 2018 and 2017. India and the US are more important sources of migratory talent moving into and India and the US are more important sources of migratory talent moving into and within the European tech within the European tech industry than any single European source country. industry than any single European source country Top 10 source countries for all movers into India 21% and within the European tech industry United States 9% United Kingdom 7% Germany 5% France 4% Brazil 4% Spain 3% Italy 3% Netherlands 2% Russia 2% 0 3 5 8 10 13 15 18 20 23 % of tech movers Note: All interpretations of the LinkedIn data are made by Atomico, not LinkedIn. A 'mover' is deïned by LinkedIn as somebody now Source: working in the tech industry that has moved country or industry sector for their primary employment between 2018 and 2017. & 48 In Partnership with www.thestateofeuropeantech.com
 The State of European Tech Page 47 Page 49