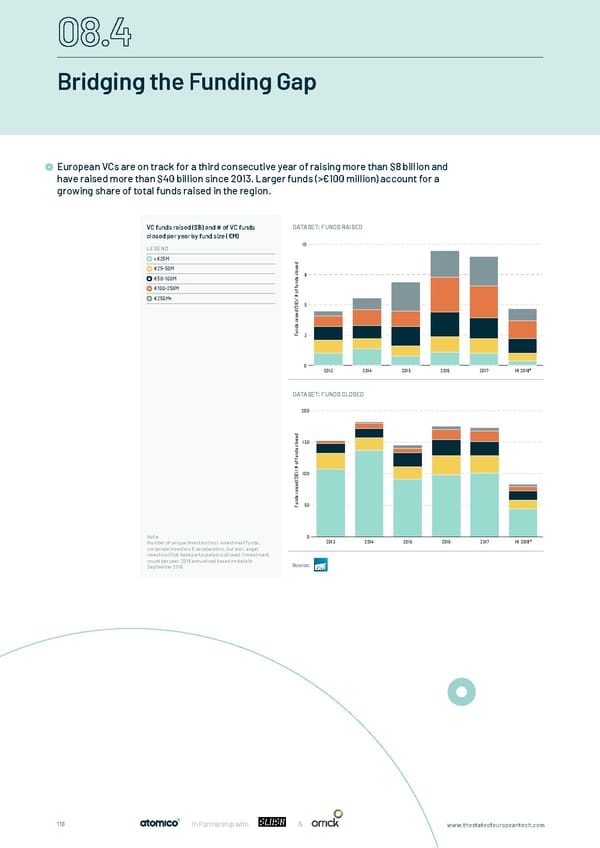
Bridging the Funding Gap European VCs are on track for a third consecutive year of raising more than $8 billion and have raised more than $40 billion since 2013. Larger funds (>€100 million) account for a European VCs are on track for a third consecutive year of raising more than $8 billion and have raised more than growing share of total funds raised in the region. $40 billion since 2013. Larger funds (>€100 million) account for a growing share of total funds raised in the region. VC funds raised ($B) and # of VC funds DATASET: FUNDS RAISED closed per year by fund size (€M) 10 LEGEND <€25M d e €25-50M s o l c 8 €50-100M s d n u f €100-250M f o # €250M+ / ) B 5 $ ( d e s i a r s d n u F 3 0 2013 2014 2015 2016 2017 H1 2018* European VCs are on track for a third consecutive year of raising more than $8 billion and have raised more than $40 billion since 2013. Larger funds (>€100 million) account for a growing share of total funds raised in the region. DATASET: FUNDS CLOSED VC funds raised ($B) and # of VC funds 200 closed per year by fund size (€M) DATASET: FUNDS CLOSED d e s o 150 l LEGEND c s d <€25M n u f f o €25-50M # / ) 100 €50-100M B $ ( d €100-250M e s i a r €250M+ s d n u 50 F Note: 0 Number of unique investors (incl. investment funds, 2013 2014 2015 2016 2017 H1 2018* corporate investors & accelerators, but excl. angel Note: investors) that have participated in at least 1 investment Total funds raised are displayed in USD, but the grouping of round per year. 2018 annualised based on data to funds by fund size is based on EUR. Taken from the European Source: September 2018. Data Collective, developed by Invest Europe. EDC data converted at EUR:USD of 1.1605, the rate on 30 Sep 2018. H1 2018 preliminary. 116 In Partnership with & www.thestateofeuropeantech.com
 The State of European Tech Page 115 Page 117