
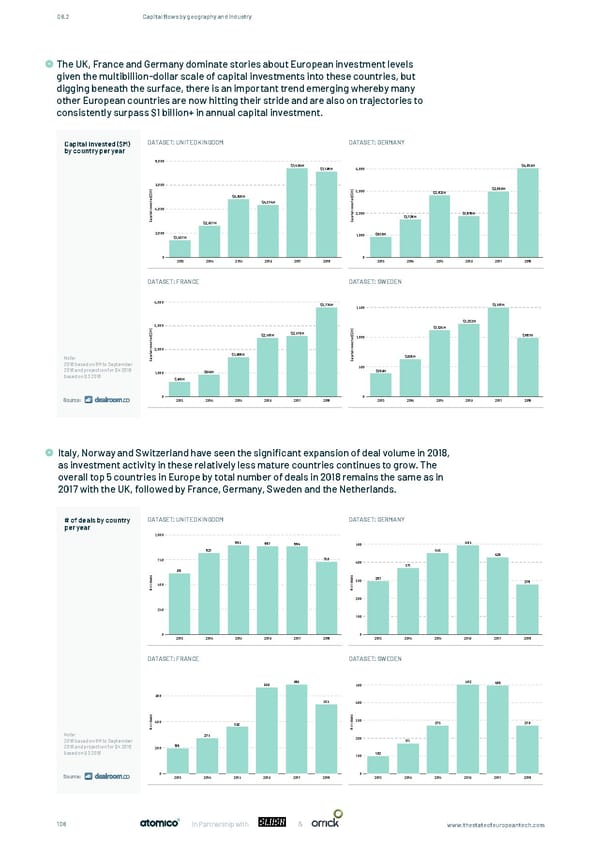
08.2 Capital flows by geography and industry The UK, France and Germany dominate stories about European investment levels given the multibillion-dollar scale of capital investments into these countries, but digging beneath the surface, there is an important trend emerging whereby many other European countries are now hitting their stride and are also on trajectories to consistently surpass $1 billion+ in annual capital investment. The UK, France and Germany dominate stories about European investmTehnet U leKv,e Flrsa gnicveen a tnhde G merumltai-nbyil dlioonm sincaatlee o sftories about European investment levels given the multi-billion scale of capital investments into these countries, but digging beneath the surfaccaep,i ttahle irnev iess atmn iemnpts iornttaon tt threesend c eomunetrrgieinsg, but digging beneath the surface, there is an important trend emerging whereby many other European countries are now hitting their stride anwdh aelsreob oyn m traanjeyc ottohreier Es tuor copoenasnis cteonutnlytries are now hitting their stride and also on trajectories to consistently surpass $1B+ in annual capital investment. surpass $1B+ in annual capital investment. Capital invested ($M) DATASET: UNITED KINGDOM DATASET: GERMANY by country per year Capital invested ($M) by country per year 8,000 Capital invested ($M) by country per year $7,404M $7,168M $4,036M DATASET: UNITED KINGDOM DATASET: GERMANY 4,000 LEGEND LEGEND United Kingdom 6,000 Germany ) )3,000 $2,990M M M $2,821M $ $ ( ( $4,861M d d e e t $4,374M t s s e e v v n n i 4,000 i l l a a2,000 $1,878M t t $1,728M pi pi a a C $2,637M C 2,000 1,000 $930M $1,437M The UK, France and Germany dominate stories about European investmTehnet U leKv,e Flrsa gnicveen a tnhde G merumltai-nbyil dlioonm sincaatlee o sftories about European investment levels given the multi-billion scale of 0 0 2013 2014 2015 2016 2017 2018 2013 2014 2015 2016 2017 2018 capital investments into these countries, but digging beneath the surfaccaep,i ttahle irnev iess atmn iemnpts iornttaon tt threesend c eomunetrrgieinsg, but digging beneath the surface, there is an important trend emerging Note: Note: whereby many other European countries are now hitting their stride anwdh aelsreob oyn m traanjeyc ottohreier Es tuor copoenasnis cteonutnlytries are now hitting their stride and also on trajectories to consistently 2018 based on 9M to September 2018 and projection for Q4 2017 Source: 2018 based on 9M to September 2018 and projection for Q4 2017 Source: based on Q3 2018. based on Q3 2018. surpass $1B+ in annual capital investment. surpass $1B+ in annual capital investment. DATASET: FRANCE DATASET: SWEDEN Capital invested ($M) by country per year 4,000 Capital invested ($M) by country per year $3,774M 1,500 $1,501M DATASET: FRANCE DATASET: SWEDEN LEGEND LEGEND $1,232M France ) 3,000 Sweden ) $1,124M M M $ $2,579M $ ( ( $2,501M $987M d d 1,000 e e t t s s e e v v n n i i 2,000 l l a a t $1,688M t pi pi $638M Note: a a 2018 based on 9M to September C C 2018 and projection for Q4 2018 500 1,000 $941M $396M based on Q3 2018 $619M 0 0 2013 2014 2015 2016 2017 2018 2013 2014 2015 2016 2017 2018 Note: Note: 2018 based on 9M to September 2018 and projection for Q4 2017 Source: 2018 based on 9M to September 2018 and projection for Q4 2017 Source: based on Q3 2018. based on Q3 2018. Italy, Norway and Switzerland have seen the significant expansion of deal volume in 2018, as investment activity in these relatively less mature countries continues to grow. The overall top 5 countries in Europe by total number of deals in 2018 remains the same as in 2017 with the UK, followed by France, Germany, Sweden and the Netherlands. Italy, Norway and Switzerland have seen the signiïcant expansion of deItaall vy,o Nluomrwe iany 2 a0n1d8 S, awsit iznevrelasntmd henatv ae scteivienty t ihne signiïcant expansion of deal volume in 2018, as investment activity in these relatively less mature countries continues to grow. The overall totph 5ese co ruenlatrtiievse ilyn le Esus mropaet buyre t cotoaul nnturmiebs cero onftinues to grow. The overall top 5 countries in Europe by total number of deals in 2018 remains the same as in 2017 with the UK, followed by Frandceea, Gls iernm 2a0n18y, r Sewmeadines then and sa thme Ne aesth ine 2rla0n17d ws.ith the UK, followed by France, Germany, Sweden and the Netherlands. # of deals by country DATASET: UNITED KINGDOM DATASET: GERMANY per year # of deals by country per year 1,000 # of deals by country per year 895 887 884 500 495 DATASET: UNITED KINGDOM 821 DATASET: GERMANY 453 LEGEND LEGEND 429 750 730 United Kingdom Germany 400 371 613 s s l l a a 297 e e300 278 d d f 500 f o o # # 200 250 100 0 0 2013 2014 2015 2016 2017 2018 2013 2014 2015 2016 2017 2018 Italy, Norway and Switzerland have seen the signiïcant expansion of deItaall vy,o Nluomrwe iany 2 a0n1d8 S, awsit iznevrelasntmd henatv ae scteivienty t ihne signiïcant expansion of deal volume in 2018, as investment activity in Note: Note: these relatively less mature countries continues to grow. The overall totph 5ese co ruenlatrtiievse ilyn le Esus mropaet buyre t cotoaul nnturmiebs cero onftinues to grow. The overall top 5 countries in Europe by total number of 2018 based on 9M to September 2018 and projection for Q4 2018 Source: 2018 based on 9M to September 2018 and projection for Q4 2018 Source: based on Q3 2018. based on Q3 2018. deals in 2018 remains the same as in 2017 with the UK, followed by Frandceea, Gls iernm 2a0n18y, r Sewmeadines then and sa thme Ne aesth ine 2rla0n17d ws.ith the UK, followed by France, Germany, Sweden and the Netherlands. DATASET: FRANCE DATASET: SWEDEN # of deals by country per year # of deals by country per year 666 686 500 502 499 DATASET: FRANCE DATASET: SWEDEN LEGEND 600 LEGEND France Sweden 535 400 s s l l a a e e300 d 400 d 273 270 f 362 f o o # # Note: 275 200 2018 based on 9M to September 171 2018 and projection for Q4 2018 200 199 based on Q3 2018 100 102 0 0 2013 2014 2015 2016 2017 2018 2013 2014 2015 2016 2017 2018 Note: Note: 2018 based on 9M to September 2018 and projection for Q4 2018 Source: 2018 based on 9M to September 2018 and projection for Q4 2018 Source: based on Q3 2018. based on Q3 2018. 108 In Partnership with & www.thestateofeuropeantech.com
 The State of European Tech Page 107 Page 109