
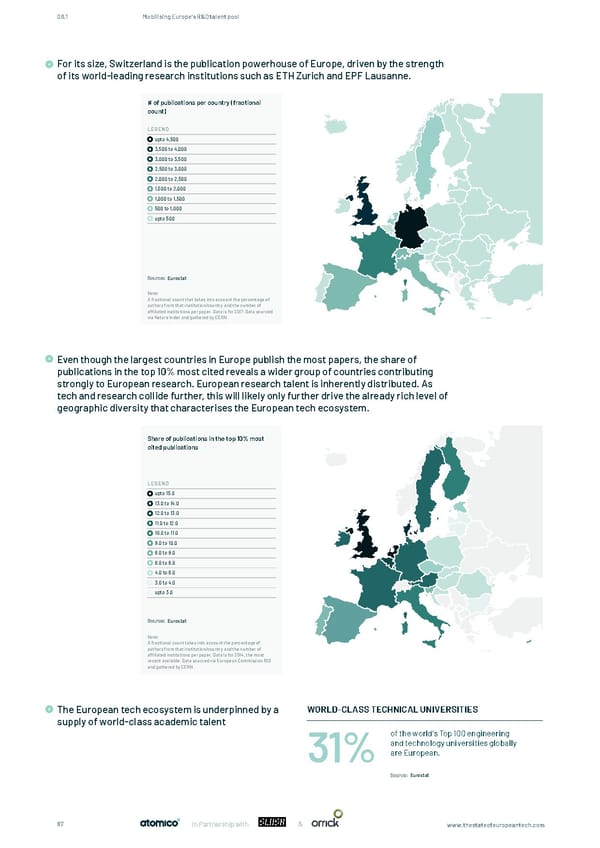
06.1 Mobilising Europe’s R&D talent pool For its size, Switzerland is the publication powerhouse of Europe, driven by the strength of its world-leading For its size, Switzerland is the publication powerhouse of Europe, driven by the strength of its world-leading research institutions such as ETH Zurich and EPF Lausanne. For its size, Switzerland is the publication powerhouse of Europe, driven by the strength For its size, Switzerland is the publication powerhouse of Europe, driven by the strength of its world-leading research institutions such as ETH Zurich and EPF Lausanne. research institutions such as ETH Zurich and EPF Lausanne. of its world-leading research institutions such as ETH Zurich and EPF Lausanne. # of publications per country (fractional count) # of publications per country (fractional # of publications per country (fractional count) count) LEGEND upto 4,500 LEGEND LEGEND 3,500 to 4,000 upto 4,500 upto 4,500 3,000 to 3,500 3,500 to 4,000 2,500 to 3,000 3,500 to 4,0003,000 to 3,500 2,000 to 2,500 2,500 to 3,000 3,000 to 3,5001,500 to 2,000 2,000 to 2,500 2,500 to 3,0001,000 to 1,500 1,500 to 2,000 500 to 1,000 1,000 to 1,500 2,000 to 2,500 upto 500 1,500 to 2,000500 to 1,000 upto 500 1,000 to 1,500 500 to 1,000 upto 500 Eurostat Note: A fractional count that takes into account the percentage of Source: Eurostat authors from that institution/country and the number of Note: aíliated institutions per paper. Data is for 2017. Data sourced Source: Eurostat A fractional count that takes into account the percentage of via Nature Index and gathered by CERN. authors from that institution/country and the number of aíliated institutions per paper. Data is for 2017. Data sourced via Nature Index and gathered by CERN. Even though the largest countries in Europe publish the most papers, the share of publications in the top 10% Even though the largest countries in Europe publish the most papers, the share of Note: publications in the top 10% most cited reveals a wider group of countries contributing most cited reveals a wider group of countries contributing strongly to European research. European research Even though the largest countries in Europe publish the most papers, the share of publications in the top 10% A fractional count that takes into account the percentage of Source: Eurostat Even though the largest countries in Europe publish the most papers, the share of publications in the top 10% authors from that institution/country and the number of strongly to European research. European research talent is inherently distributed. As most cited reveals a wider group of countries contributing strongly to European research. European research talent is inherently distributed. As tech and research collide further, this will likely only further drive the already aíliated institutions per paper. Data is for 2017. Data sourced most cited reveals a wider group of countries contributing strongly to European research. European research talent is inherently distributed. As tech and research collide further, this will likely only further drive the already tech and research collide further, this will likely only further drive the already rich level of via Nature Index and gathered by CERN. rich level of geographic diversity that characterises the European tech ecosystem. talent is inherently distributed. As tech and research collide further, this will likely only further drive the already rich level of geographic diversity that characterises the European tech ecosystem. geographic diversity that characterises the European tech ecosystem. rich level of geographic diversity that characterises the European tech ecosystem. Share of publications in the top 10% most Share of publications in the top 10% most Share of publications in the top 10% most cited publications cited publications cited publications LEGEND LEGEND upto 15.0 LEGEND upto 15.0 13.0 to 14.0 upto 15.0 13.0 to 14.0 12.0 to 13.0 12.0 to 13.0 13.0 to 14.0 11.0 to 12.0 11.0 to 12.0 12.0 to 13.0 10.0 to 11.0 10.0 to 11.0 9.0 to 10.0 11.0 to 12.0 9.0 to 10.0 8.0 to 9.0 8.0 to 9.0 10.0 to 11.0 6.0 to 8.0 6.0 to 8.0 9.0 to 10.0 4.0 to 6.0 4.0 to 6.0 3.0 to 4.0 8.0 to 9.0 3.0 to 4.0 upto 3.0 6.0 to 8.0 upto 3.0 4.0 to 6.0 3.0 to 4.0 Eurostat upto 3.0 Note: A fractional count takes into account the percentage of Note: authors from that institution/country and the number of A fractional count takes into account the percentage of aíliated institutions per paper. Data is for 2014, the most authors from that institution/country and the number of recent available. Data sourced via European Commission RIO aíliated institutions per paper. Data is for 2014, the most and gathered by CERN. recent available. Data sourced via European Commission RIO and gathered by CERN. Note: A fractional count takes into account the percentage of WORLD-CLASS TECHNICAL UNIVERSITIES The European tech ecosystem is underpinned by a authors from that institution/country and the number of supply of world-class academic talent aíliated institutions per paper. Data is for 2014, the most recent available. Data sourced via European Commission RIO of the world’s Top 100 engineering and gathered by CERN. and technology universities globally 31% are European. Eurostat & 87 In Partnership with www.thestateofeuropeantech.com
 The State of European Tech Page 86 Page 88