
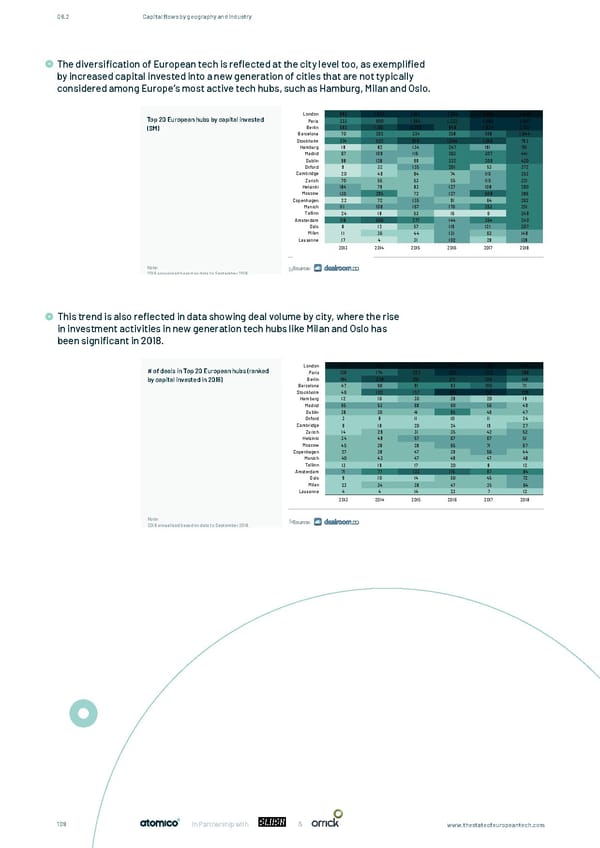
08.2 Capital flows by geography and industry The diversification of European tech is reflected at the city level too, as exemplified The diversi�cation of European tech is re�ected at the city level too, as exempli�ed by increased capital invested by increased capital invested into a new generation of cities that are not typically into a new generation of cities that are not typically considered among Europe's most active tech hubs, such as considered among Europe’s most active tech hubs, such as Hamburg, Milan and Oslo. Hamburg, Milan and Oslo. London 892 1,622 3,011 3,065 5,654 4,426 Top 20 European hubs by capital invested Paris 333 600 1,065 1,332 1,686 2,607 ($M) Berlin 592 1,165 2,270 948 1,824 2,221 Barcelona 70 262 334 258 568 1,044 Stockholm 374 522 916 1,044 1,016 793 Hamburg 18 82 134 247 191 761 Madrid 67 109 116 263 307 441 Dublin 98 128 99 332 309 420 Oxford 9 32 135 201 53 372 Cambridge 20 49 94 74 116 352 Zurich 70 55 53 55 110 321 Helsinki 184 79 83 127 108 290 Moscow 130 295 72 127 608 286 Copenhagen 22 72 135 91 64 262 Munich 111 109 167 170 253 251 Tallinn 24 18 53 16 6 249 Amsterdam 218 556 277 144 354 240 Oslo 8 12 57 119 121 207 Milan 11 36 44 131 63 148 Lausanne 17 4 31 102 28 138 2013 2014 2015 2016 2017 2018 Note: Source: 2018 annualised based on data to September 2018. This trend is also reflected in data showing deal volume by city, where the rise in investment activities in new generation tech hubs like Milan and Oslo has This trend is also re�ected in data showing deal volume by city, where the rise in investment activities in new been significant in 2018. generation tech hubs like Milan and Oslo has been signi�cant in 2018. London 414 581 641 608 598 489 # of deals in Top 20 European hubs (ranked Paris 126 174 223 352 332 288 by capital invested in 2018) Berlin 184 238 261 271 210 149 Barcelona 47 66 91 93 105 71 Stockholm 46 102 157 305 312 209 Hamburg 12 16 30 39 20 19 Madrid 65 53 69 60 56 49 Dublin 38 36 41 95 49 47 Oxford 3 8 11 10 11 24 Cambridge 9 18 20 24 19 27 Zurich 14 29 31 35 42 52 Helsinki 34 48 57 67 67 51 Moscow 45 38 28 65 71 67 Copenhagen 27 38 47 39 56 44 Munich 40 43 47 49 47 48 Tallinn 13 19 17 20 8 12 Amsterdam 71 77 123 115 97 84 Oslo 9 10 14 50 45 72 Milan 23 34 38 47 35 64 Lausanne 4 4 14 23 7 12 2013 2014 2015 2016 2017 2018 Note: Source: 2018 annualised based on data to September 2018. 109 In Partnership with & www.thestateofeuropeantech.com
 The State of European Tech Page 108 Page 110