
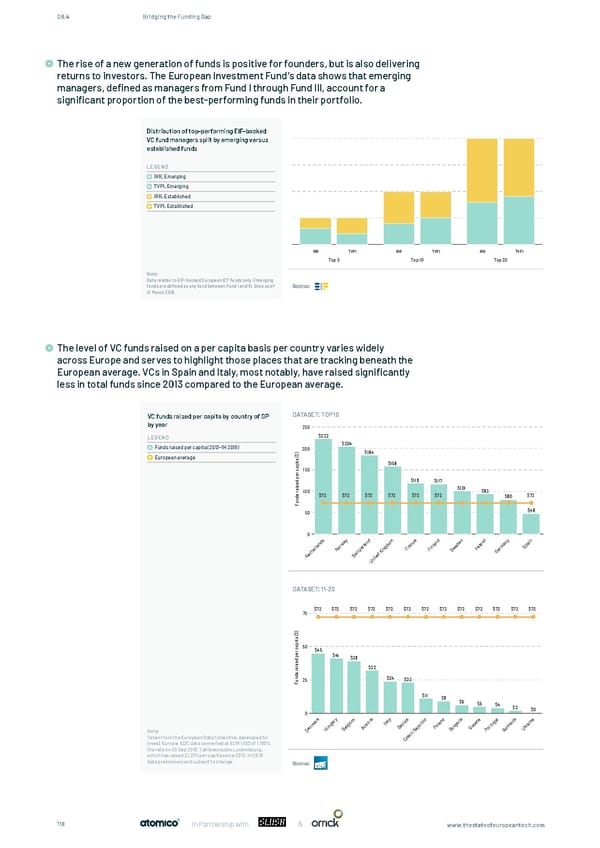
08.4 Bridging the Funding Gap The rise of a new generation of funds is positive for founders, but is also delivering returns to investors. The European Investment Fund’s data shows that emerging The rise of a new generation of funds is positive for founders, but is also delivering returns to investors. The managers, defined as managers from Fund I through Fund III, account for a European Investment Fund's data shows that emerging managers, deïned as managers from Fund I through Fund significant proportion of the best-performing funds in their portfolio. III, account for a signiïcant proportion of the best-performing funds in their portfolio. Distribution of top-performing EIF-backed VC fund managers split by emerging versus established funds LEGEND IRR, Emerging TVPI, Emerging IRR, Established TVPI, Established IRR TVPI IRR TVPI IRR TVPI Top 5 Top 10 Top 20 Note: Data relates to EIF-backed European ICT funds only. Emerging funds are deïned as any fund between Fund I and III. Data as of Source: 31 March 2018. The level of VC funds raised on a per capita basis per country varies widely across Europe and serves to highlight those places that are tracking beneath the The level of VC funds raised on a per capita basis per country varies widely across Europe and serves to highlight European average. VCs in Spain and Italy, most notably, have raised significantly those places that are tracking beneath the European average. VCs in Spain and Italy, most notably, have raised less in total funds since 2013 compared to the European average. signi cantly less in total funds since 2013 compared to the European average. VC funds raised per capita by country of GP DATASET: TOP 10 by year 250 LEGEND $222 Funds raised per capita (2013-1H 2018) $204 ) 200 $184 $ ( European average a t $158 pi a c 150 r pe $119 d $117 e s i $101 a $93 r 100 s $72 $72 $72 $72 $72 $72 $80 $72 d n u F 50 $48 0 s y d e d n d y n d a n m c n e n n i n w a o n a d a a a a r l d a l e l p l r g r n e m S r o e i w r r e z n F F I h N t i S e i K G t w e S d N e t i n U The level of VC funds raised on a per capita basis per country varies widely across Europe and serves to highlight those places that are tracking beneath the European average. VCs in Spain and Italy, most notably, have raised signiïcantly less in total funds since 2013 compared to the European average. DATASET: 11-20 VC funds raised per capita by country of GP $72 $72 $72 $72 $72 $72 $72 $72 $72 $72 $72 $72 $72 75 by year DATASET: 11-20 ) $ ( a t LEGEND pi a 50 c $45 Funds raised per capita (2013-1H 2018) r $41 pe $39 d e European average s i $32 a r s d n 25 $24 $23 u F $11 $9 $6 $5 $4 $2 $0 0 k y a y s c d a e l a e r r m i l i i a i r a c l n r c n a a u t t i b a e g n i i I t l a u a a m g g s l u g e t r n n l u a p o l r r m k e u e A B e P u G o o U D H B R B P R Note: h c Taken from the European Data Collective, developed by e z Invest Europe. EDC data converted at EUR:USD of 1.1605, C the rate on 30 Sep 2018. Table excludes Luxembourg, Note: which has raised $1,074 per capita since 2013. H12018 Taken from the European Data Collective, developed by Invest data preliminary and subject to change. Europe. EDC data converted at EUR:USD of 1.1605, the rate on Source: 30 Sep 2018. Table excludes Luxembourg, which has raised $1,074 per capita since 2013. H12018 data preliminary and subject to change. & 118 In Partnership with www.thestateofeuropeantech.com
 The State of European Tech Page 117 Page 119